Getting Started
It only takes a few minutes to get StreamAlert up and running! These instructions have been tested on MacOS, but should also work on most linux systems.
Install Dependencies
brew install terraform  # MacOS Homebrew
terraform --version     # Must be >= v0.13.0
Note
Terraform versions lower than 0.13 are not supported. We recommend installing Terraform version 0.13.0 or greater.
If you are using Linux, you may need to install the Python development libraries:
sudo apt install python-dev    # Debian
sudo yum install python-devel  # CentOS/RHEL
Download StreamAlert
Clone the latest stable release of StreamAlert:
git clone --branch stable https://github.com/airbnb/streamalert.git
Create and activate a virtual environment:
cd streamalert
python3.7 -m venv venv
source venv/bin/activate
Install the StreamAlert requirements:
pip install -r requirements.txt
Run unit tests to make sure everything is installed correctly:
tests/scripts/unit_tests.sh
Configure AWS Credentials
1. Create an AWS account and an IAM user with permissions for at least the following services:
Athena
CloudTrail
CloudWatch Events and Logs
DynamoDB
Glue
IAM
Kinesis Firehose and Streams
KMS
Lambda
S3
SNS
SQS
Configure your AWS credentials
pip install --user awscli
aws configure
Deploy
Note
StreamAlert supports Terraform’s native ability to lock the remote s3 state file whenever a user is planning and applying Terraform configuration. This is to prevent multiple users from deploying StreamAlert at the same time potentially resulting in a broken state. StreamAlert will automatically create and destroy this table via the command line interface. See Terraform’s documentation for more information.
Set basic StreamAlert configuration options:
python manage.py configure aws_account_id 111111111111  # Replace with your 12-digit AWS account ID
python manage.py configure prefix <value>               # Choose a unique name prefix (alphanumeric characters only)

.. code-block:: bash

  "athena_partitioner_config": {
    "concurrency_limit": 10,
    "file_format": "parquet",
    "log_level": "info"
  }

* More information can be found on the `historical search <historical-search.html>`_ page.
Build the StreamAlert infrastructure for the first time:
python manage.py init
There will be multiple Terraform prompts, type “yes” at each one to continue.
Note
You only need to python manage.py init once for any given StreamAlert deployment,
although it is safe to run again if necessary.
3. At this point, StreamAlert is up and running! You can, for example, see the S3 buckets that were automatically created:
aws s3 ls | grep streamalert
You can also login to the AWS web console and see StreamAlert’s CloudWatch logs, Lambda functions, etc.
Live Test
Now let’s upload some data and trigger an alert to see StreamAlert in action! This example uses SNS for both sending the log data and receiving the alert, but StreamAlert also supports many other data sources and alert outputs.
Create 2 SNS topics:
aws sns create-topic --name streamalert-test-data
aws sns create-topic --name streamalert-test-alerts
Export some environment variables for easy re-use later:
export SA_REGION=us-east-1        # StreamAlert deployment region
export SA_ACCOUNT=111111111111    # AWS account ID
export SA_EMAIL=email@domain.com  # Email to receive an SNS notification
Subscribe your email to the alerts SNS topic:
aws sns subscribe --topic-arn arn:aws:sns:$SA_REGION:$SA_ACCOUNT:streamalert-test-alerts \
    --protocol email --notification-endpoint $SA_EMAIL
Note
You will need to click the verification link in your email to activate the subscription.
4. Add the streamalert-test-data SNS topic as an input to the (default) prod cluster.
Open conf/clusters/prod.json and change the streamalert module to look like this:
{
  "classifier_config": {
    "enable_custom_metrics": true,
    "inputs": {
      "aws-sns": [
        "arn:aws:sns:REGION:ACCOUNTID:streamalert-test-data"
      ]
    },
    "log_level": "info",
    "log_retention_days": 14,
    "memory": 128,
    "timeout": 60
  }
}
5. Tell StreamAlert which log schemas will be sent to this input.
Open conf/clusters/prod.json and change the data_sources section to look like this:
{
  "data_sources": {
    "sns": {
      "streamalert-test-data": [
        "cloudwatch"
      ]
    }
  }
}
Add the alert topic as a StreamAlert output:
python manage.py output set aws-sns

Please supply a short and unique descriptor for this SNS topic: test-email

Please supply SNS topic name: streamalert-test-alerts
If you look at conf/outputs.json, you’ll notice that the SNS topic was automatically added.
7. Configure a rule to send to the alerts topic.
We will use rules/community/cloudwatch_events/cloudtrail_root_account_usage.py as an example, which
alerts on any usage of the root AWS account. Change the rule decorator to:
@rule(
    logs=['cloudwatch:events'],
    req_subkeys={'detail': ['userIdentity', 'eventType']},
    outputs=['aws-sns:test-email']  # Add this line
)
def cloudtrail_root_account_usage(rec):
Now we need to update StreamAlert with these changes:
# Hook the streamalert-test-data SNS topic up to the StreamAlert Classifier function
python manage.py build

# Deploy a new version of all of the Lambda functions with the updated rule and config files
python manage.py deploy
Note
Use build and deploy to apply any changes to StreamAlert’s
configuration or Lambda functions, respectively. Some changes (like this example) require both.
Time to test! Create a file named
cloudtrail-root.jsonwith the following contents:
{
  "account": "1234",
  "detail": {
    "eventType": "AwsConsoleSignIn",
    "userIdentity": {
      "type": "Root"
    }
  },
  "detail-type": "CloudTrail Test",
  "id": "1234",
  "region": "us-east-1",
  "resources": [],
  "source": "1.1.1.2",
  "time": "now",
  "version": "2018"
}
This is only a rough approximation of what the real log might look like, but good enough for our purposes. Then send it off to the data SNS topic:
aws sns publish --topic-arn arn:aws:sns:$SA_REGION:$SA_ACCOUNT:streamalert-test-data \
    --message "$(cat cloudtrail-root.json)"
If all goes well, an alert should arrive in your inbox within a few minutes! If not, look for any errors in the CloudWatch Logs for the StreamAlert Lambda functions.
10. After 10 minutes (the default refresh interval), the alert will also be searchable from
Amazon Athena. Select your StreamAlert database in the
dropdown on the left and preview the alerts table:
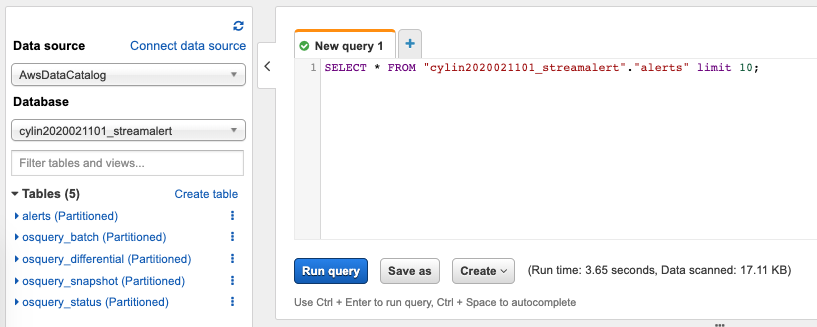
(Here, my name prefix is testv2.) If no records are returned, look for errors
in the Athena Partitioner function or try invoking it directly.
And there you have it! Ingested log data is parsed, classified, and scanned by the rules engine. Any resulting alerts are delivered to your configured output(s) within a matter of minutes.